
Product pages that lag, a checkout that hesitates, an order list timing out in the Back Office. Nine times out of ten the database is responsible, not PHP. What makes busy shops predictable is where the damage concentrates: slow SQL queries in PrestaShop gather around four tables that gain rows daily and shed none, namely ps_cart, ps_cart_product, ps_orders, and ps_order_detail. Four steps will find them. Switch on the slow query log, sort what it captures by total time, run EXPLAIN against the worst entries, then change the query or the index. No guessing involved. Each section below handles one step, along with the patterns that punish cart and order data hardest.
1.0 Why cart and order tables become the biggest bottleneck
Your catalogue barely moves. Index it once and it performs much the same whether you sell 1,000 SKUs or 50,000. Cart and order data behaves nothing like that, since it only ever grows.
Four things pile up as traffic increases:
- Rows that never leave. Nearly any visitor who touches the basket earns a row in ps_cart, bots included. Nothing expires those rows for you, so ps_cart and ps_cart_product keep climbing long after the sessions died.
- Indexes pointing the wrong way. Core keys favour lookups by id_cart or id_order, while reports, modules, and admin filters tend to search by product, date range, or status.
- Loops instead of sets. Cart rules, promotions, and careless module hooks handle one item at a time, which turns a single page view into dozens of round trips.
- Back Office joins that sprawl. Order screens stitch together customers, order states, carriers, countries, and shops, then sort and paginate whatever comes back.
Checkout and admin screens therefore buckle before the catalogue does. Use that as your tell. Quick product pages next to a crawling /order list point straight at cart and order tables.
2.0 Start with the PrestaShop slow query log
Begin here. The log reports what your server genuinely ran under live traffic, not what you assume it ran, and no other tool gives you that for free.
3.0 Pick a threshold that suits a shop
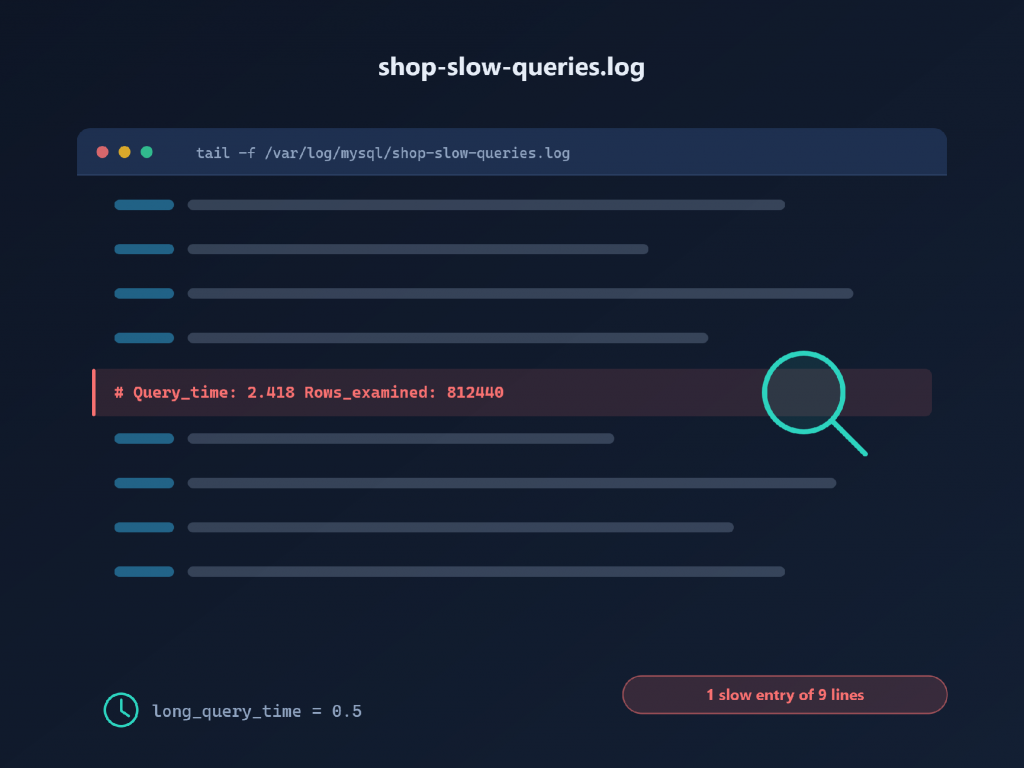
Straight out of the box, long_query_time sits at 10 seconds. For retail that figure is meaningless. A 900 ms cart query stays completely invisible while it quietly costs you conversions. Bring the number down, and capture index-less queries while you are there.
# Example my.cnf settings — tune before applying anywhere near production.
[mysqld]
slow_query_log                = 1
slow_query_log_file           = /var/log/mysql/shop-slow-queries.log
long_query_time               = 0.5
log_queries_not_using_indexes = 1
min_examined_row_limit        = 1000
log_slow_admin_statements     = 1
Begin at 0.5 seconds. Drop to 0.1 after you clear the obvious offenders. Watch out for one side effect: log_queries_not_using_indexes also catches trivial reads against configuration tables, and min_examined_row_limit is what keeps the file readable once it does.
Runtime changes work too, with a gotcha. long_query_time applies to new connections, so PHP-FPM workers sitting on persistent connections keep the old threshold until they recycle. The MySQL slow query log documentation lists every related variable.
-- Runtime enable. Affects new connections only.
SET GLOBAL slow_query_log  = 'ON';
SET GLOBAL long_query_time = 0.5;
Running MariaDB, as plenty of PrestaShop hosts do? Add log_slow_verbosity = query_plan,explain. Every entry then arrives with its query plan attached, which saves you an analysis pass later on.
4.0 Turn the raw log into a ranked list
Raw logs are unusable at volume, so aggregate them by query fingerprint. mysqldumpslow ships with MySQL and needs no installation:
mysqldumpslow -s t -t 20 /var/log/mysql/shop-slow-queries.log   # sorted by total time
mysqldumpslow -s c -t 20 /var/log/mysql/shop-slow-queries.log   # sorted by call count
Percona Toolkit’s pt-query-digest does the job properly. Literal values collapse into fingerprints, entries rank by total time, and each one carries rows examined against rows returned. Pay attention to that last pair. Nothing else points at a missing index quite so bluntly.
Here is the part teams get wrong. Read the report by total time rather than worst case. A three-second report that runs twice daily costs you far less than a 90 ms cart query firing forty times per checkout. Yet the alarming query gets fixed, and the expensive one survives.
The log does have a blind spot. A storm of individually quick queries never crosses long_query_time, so nothing gets written. Catch those with PrestaShop’s debug profiling on a staging copy instead: _PS_DEBUG_PROFILING_ prints a panel carrying the query count for each page. Hundreds of queries on a cart page means something loops. It does not mean one statement is slow.
5.0 Read the plan with MySQL EXPLAIN
With a shortlist in hand, ask the optimiser what it intends to do. EXPLAIN estimates and nothing more. It never executes the statement, which is why running it against production stays safe.
EXPLAIN
SELECT o.id_order, o.reference, o.total_paid, c.lastname
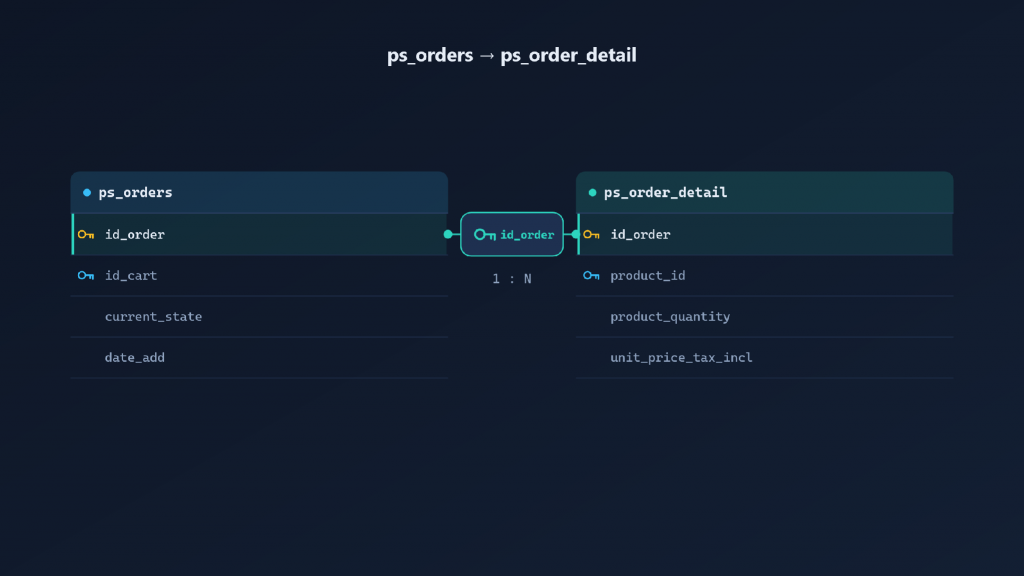
FROM ps_orders o
JOIN ps_customer c ON c.id_customer = o.id_customer
WHERE o.date_add >= '2026-01-01 00:00:00'
  AND o.current_state = 3
ORDER BY o.date_add DESC
LIMIT 50;
Four columns carry most of the meaning:
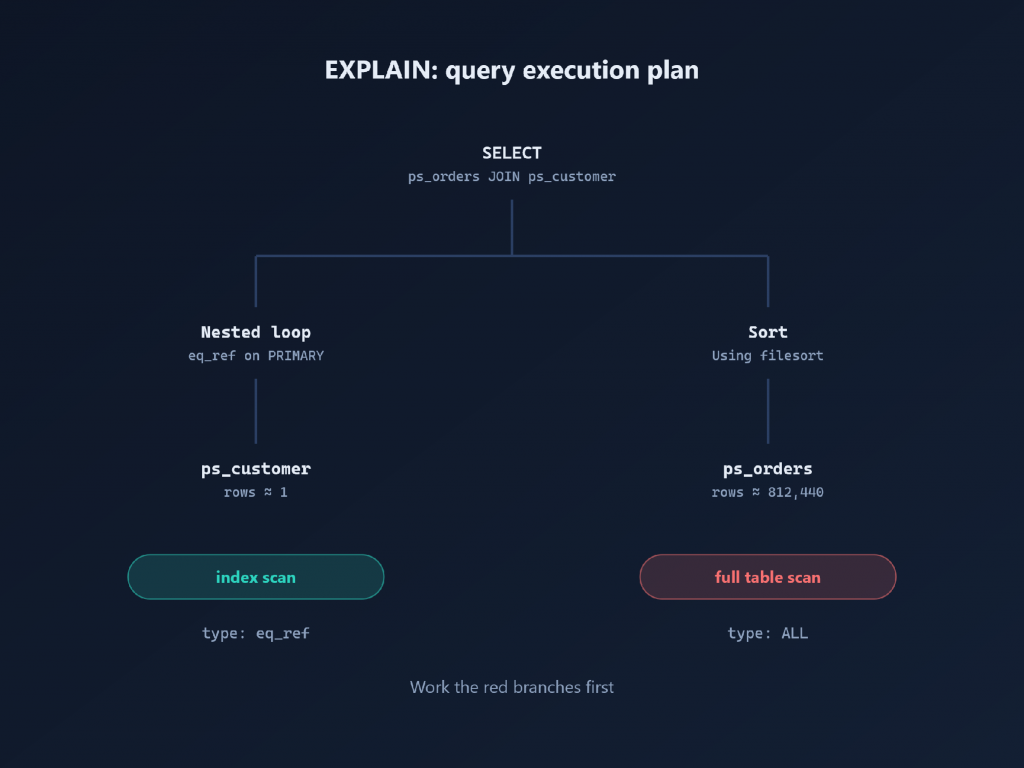
- type – the access method. const, eq_ref, and ref are healthy. range and index are acceptable. ALL means a full table scan, and on a large ps_orders that single value is usually your finding.
- key – the index actually chosen. When possible_keys lists candidates but key shows NULL, the optimiser rejected them, often because a function wraps the filtered column.
- rows and filtered – the estimated volume MySQL must touch. A large rows value combined with a low filtered percentage means the query reads far more data than it returns.
- Extra – the warnings. Using filesort and Using temporary mean no index satisfies the sort. Using index is the good case: a covering index answers the query without touching the table.
The MySQL EXPLAIN reference documents every value, and PlanetScale’s guide to reading EXPLAIN output offers a useful mental model, treat access types as a traffic light and work the red ones first.
6.0 Where EXPLAIN ANALYZE earns its place
From 8.0.18 onward, you also get EXPLAIN ANALYZE. This variant runs your query and prints measured timings and loop counts next to the estimates, which helps enormously when a plan reads well and the query still crawls. Do keep in mind that it executes. Confine it to read-only SELECTs during quiet hours.
MariaDB covers the same ground with ANALYZE SELECT, which shows actual row counts next to predicted ones. A wide gap between the two usually means stale statistics. Run ANALYZE TABLE, look again, and decide about the index afterwards.
7.0 Common slow query patterns in cart and order data
Four patterns cover nearly everything that turns up here. Each wants its own remedy, so work out which one you are holding before you touch the schema.
7.1 Product-side lookups scan ps_cart_product
Check your schema before assuming anything, since upgraded installs often differ from clean ones:
SHOW CREATE TABLE ps_cart_product;
SHOW INDEX FROM ps_cart_product;
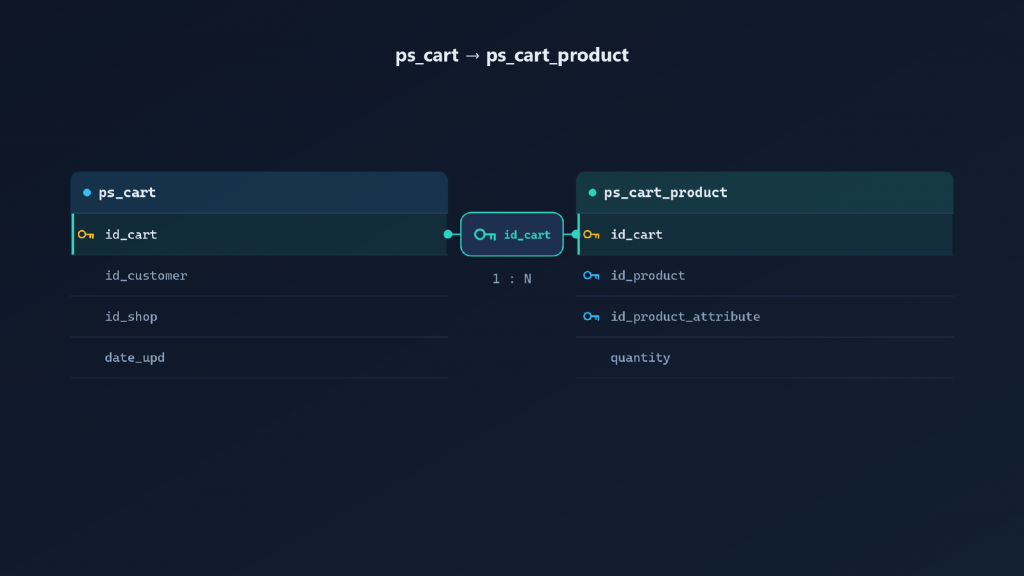
On a current schema, the primary key of ps_cart_product leads with id_cart. Cart-side reads therefore already run as index lookups, and adding another (id_cart, id_product) index buys nothing but slower writes.
Trouble starts in the opposite direction. MySQL reads an index from its leftmost column, so a key beginning with id_cart cannot serve a query that filters on id_product alone. Abandoned-cart recovery tools, stock-pressure widgets, and bulk product deletions all filter exactly that way, and all end up scanning the table.
-- Scans ps_cart_product when no index leads with the product column.
SELECT COUNT(DISTINCT cp.id_cart)
FROM ps_cart_product cp
JOIN ps_cart c ON c.id_cart = cp.id_cart
WHERE cp.id_product = 4821
  AND c.date_upd > DATE_SUB(NOW(), INTERVAL 7 DAY);
PrestaShop cart table optimization comes down to that distinction. Index what your modules genuinely query, and leave whatever core already handles alone.
7.2 Cart rules trigger N+1 query loops
Promotion logic handles rules one by one. PrestaShop collects the applicable cart rules, computes each value in turn, and every evaluation checks its own restrictions against product, category, carrier, group, and country tables. Ten active rules therefore cost ten evaluations plus their nested lookups, on every cart render and every AJAX refresh.
Each query stays fast, so the slow log never flags them. The profiler exposes the pattern instead: query count rises in step with the number of active rules.
Fix it at the source rather than with indexes. Deactivate expired rules instead of leaving them enabled with a past end date, merge overlapping promotions, and prefer narrow rules over catalogue-wide ones carrying long restriction lists.
7.3 Date filters in order reports defeat indexes
Wrapping a column in a function makes its index unusable. Custom dashboards and CSV exports do this constantly.
-- Slow: the function blocks index access.
SELECT COUNT(*) FROM ps_orders WHERE DATE(date_add) = '2026-03-14';

-- Fast: a half-open range keeps the index in play.
SELECT COUNT(*) FROM ps_orders
WHERE date_add >= '2026-03-14 00:00:00'
  AND date_add <  '2026-03-15 00:00:00';
YEAR(date_add) filters and DATE_FORMAT() grouping share the same defect. Rewrite them as ranges wherever you control the code. When you cannot — inside a closed-source module, for instance — MySQL 8.0.13 and later support functional key parts, so you can index the expression itself. MariaDB has no equivalent, though an indexed generated column achieves the same result there.
7.4 Back Office order screens join too much
The admin order list joins ps_orders to ps_customer, the order state and translation tables, and carrier, country, and shop tables. It then concatenates names for search, applies a LIKE filter, sorts, and paginates.
Two problems follow from that. Filtering or sorting on a joined or translated column, whether customer name, status label, or country, cannot use an index on ps_orders, so MySQL assembles the joined set first and sorts it after. Worse, the cost tracks your total order count instead of the page size, which explains why the screen keeps degrading as the shop grows.
Some mitigations cost nothing: reduce the default page size, keep the status filter narrow, and train staff to search by order reference instead of paging blindly.
7.4 Apply safe fixes: indexing strategy that survives upgrades
Indexes come last, never first. This is the sequence that holds up:
- Rewrite whatever SQL you own. Strip functions off filtered columns, and drop joins nobody reads.
- Cut the workload. Expire dead cart rules, tighten the admin filters.
- Refresh statistics using ANALYZE TABLE, then run EXPLAIN a second time.
- Add a single index. Measure it before and after.
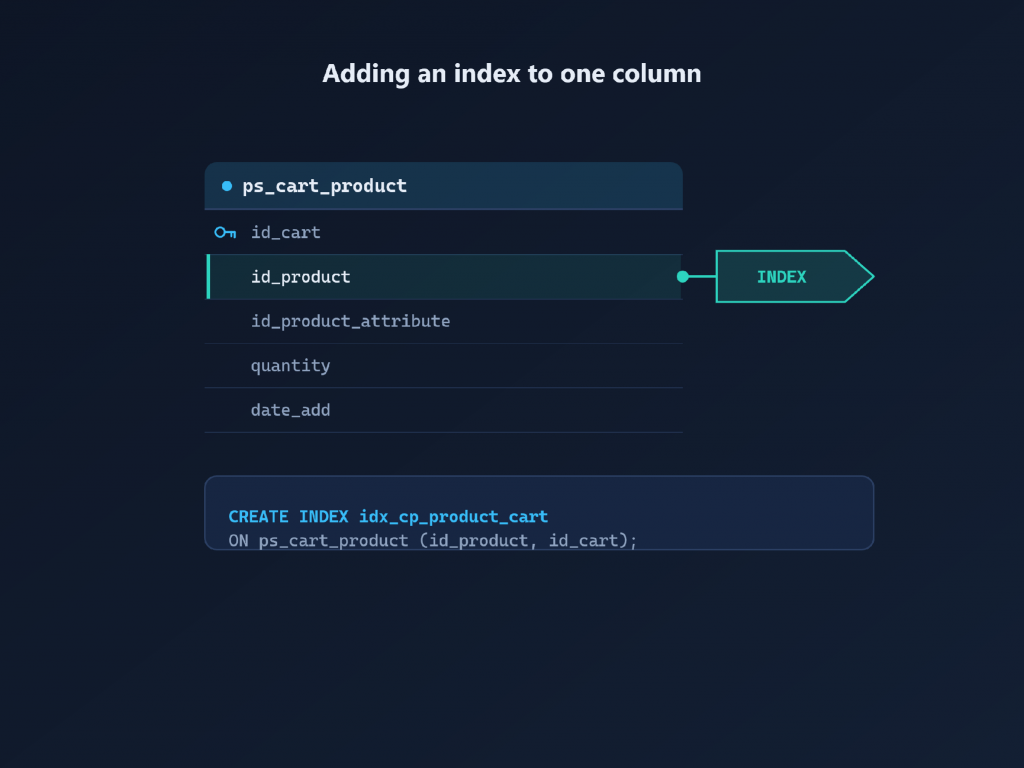
Every index slows writes and consumes buffer pool space, and cart tables absorb heavy write traffic. So add them deliberately:
-- Examples. Test on a restored copy of production first, and confirm with
-- SHOW INDEX that an equivalent index does not already exist.
CREATE INDEX idx_cp_product_cart   ON ps_cart_product (id_product, id_cart);
CREATE INDEX idx_cart_dateupd_shop ON ps_cart (date_upd, id_shop);
A few rules keep PrestaShop order table indexing safe across core and module updates:
- Never alter a primary key or add a UNIQUE constraint to a core table. Core code depends on the existing key shape, and a unique index can break legitimate checkout inserts.
- Never drop a core index because one test query ignored it. Another controller almost certainly relies on it.
- Prefix custom index names distinctively so the next developer can tell yours from core’s.
- Keep every custom index in a versioned migration with a rollback script, then re-verify after each upgrade with SHOW INDEX.
- Build indexes on very large tables during a maintenance window, or use an online schema change tool, since a blocking ALTER TABLE can break live checkouts.
8.0 Prune and archive old cart data before adding hardware
Indexes help, but shrinking the working set often helps more. Abandoned carts hold most of the dead weight, so inventory them first:
-- Read-only. How much of ps_cart is dead weight?
SELECT COUNT(*) AS abandoned_carts
FROM ps_cart c
LEFT JOIN ps_orders o ON o.id_cart = c.id_cart
WHERE o.id_order IS NULL
  AND c.date_upd < DATE_SUB(NOW(), INTERVAL 12 MONTH);
A few rules are non-negotiable. Never delete a cart that has an order behind it, since order screens and invoice regeneration still read that data. The LEFT JOIN … IS NULL condition above is what protects you. Clear child rows before parents, ps_cart_product included, plus any module table keyed on id_cart. Back up first, rehearse on a restored copy, then run production deletes in small batches instead of one long transaction during trading hours.
Keep the orders themselves. Retention rules for invoices and tax records vary by jurisdiction, so archive rather than delete when you need to shrink that set.
Tables refill, which means a single cleanup buys you months at best. Script the purge, wrap it in the order check above, and hand the job to your scheduler. Typing production deletes by hand at 2 a.m. is how accidents happen. Finish with ANALYZE TABLE so the optimiser learns the new row distribution.
9.0 Keep watching, or PrestaShop database performance drifts back
Regressions arrive quietly. A module update ships one careless query, nobody notices, and the support tickets turn up a week later. Routine checks beat incident response every time.
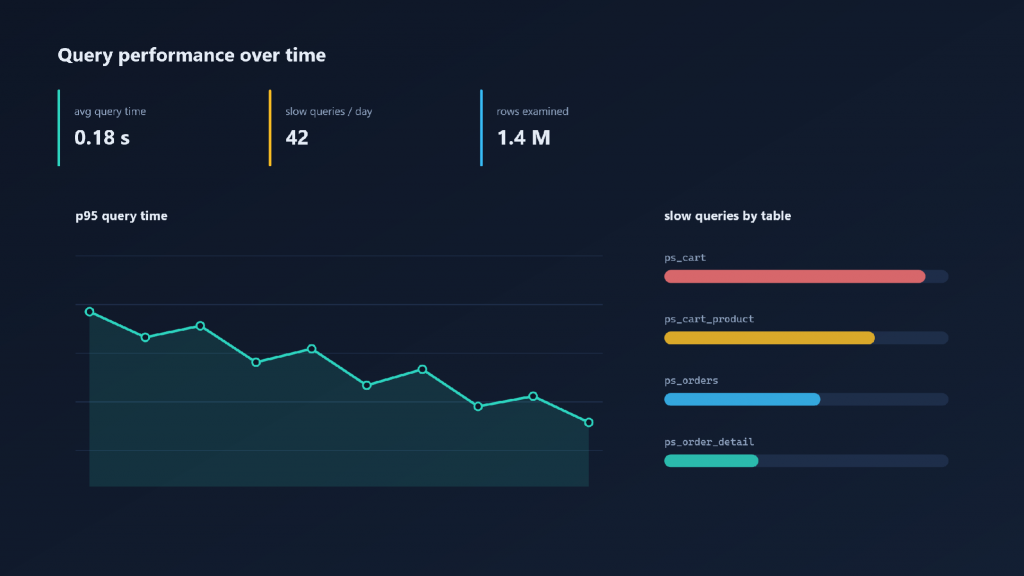
- Schedule the digest. Run pt-query-digest weekly over rotated slow logs and compare fingerprints week to week. New entries surface regressions early.
- Query the digest tables. MySQL’s Performance Schema aggregates every statement continuously, and the sys schema exposes readable views such as statement_analysis and statements_with_full_table_scans.
- Attribute queries to code. An APM tool tells you which hook, controller, or module issued a query. The slow log names the statement; APM names the code to fix.
- Scale reads separately. PrestaShop’s own scaling documentation recommends a single write instance with read replicas, since the front office generates far more reads than writes. It also suggests analysing tables after large imports so the optimiser works from current statistics.
- Give the buffer pool room. Where the database owns its server, raise innodb_buffer_pool_size until it holds as much of the working set as you can afford. Leave it cramped and a high traffic PrestaShop store will find that ceiling within days.
10.0 Conclusion
Tracking down slow SQL queries in PrestaShop is methodical work rather than detective work. Log with a sensible threshold, sort by total time, and run EXPLAIN over whatever sits at the top. Then read the plan without flattering it. A type of ALL, a NULL key, or Using filesort in Extra each point you toward a rewrite or an index.
After that, work on the data itself. Prune abandoned carts, archive old records, verify improvements with real queries instead of synthetic tests, and schedule the checks so regressions surface before customers find them. Stores that follow this loop keep checkout responsive as order volume climbs, and their Back Office stays usable at scale.
If you only do one thing this week, enable the slow query log on your busiest store and read the top ten entries. That single list usually tells you where the next month of database work belongs.
At Knowband, we help PrestaShop store owners improve performance, scalability, and stability through reliable prestashop plugins, custom website feature development, and App development.
Need assistance? Contact us at [email protected] or visit the Knowband Helpdesk.


)